Water Supply Use Reports
Updated: 03/2025
Water use reporting
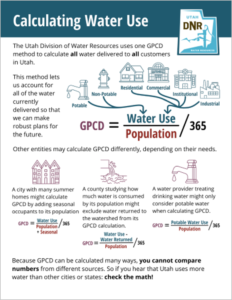
Community planners monitor water use to observe trends and adjust their plans so that communities can thrive. There isn’t a national standard for measuring and reporting water use. Gallons Per Capita per Day (GPCD) is a common metric, but it can be calculated in many ways. The Utah Division of Water Resources’ method of calculating gallons per capita per day (GPCD) accounts for all water delivered to all customers.
Utah leads the nation in comprehensive reporting
Division of Water Resources’ water use reporting program is the only program in the nation that uses one method to calculate the amount of water delivered to customers for every public water system in the state. Utah includes all potable and non-potable (reuse and secondary) water by all users (residential, commercial, institutional, and industrial) in its GPCD.
The division sums the potable and non-potable water delivered to public water system customers and divides by the full-time population within the water system service area boundary. All water delivered to customers in a year is averaged over population and divided by the number of days in a year. It seems straightforward, but it’s not. What is included in (or omitted from) ‘water use’ and ‘population’ can drastically change the resulting water use when reported in GPCD.
Utah’s State Conservation Goal for 2030 is 202 GPCD.
– In 2019 Utah’s State Total was calculated at 223 GPCD.
Leeds (LDWA Culinary) usage for:
– 2023 was calculated at 187 GPCD.
– 2022 was calculated at 216 GPCD.
– 2021 was calculated at 230 GPCD.
– 2020 was calculated at 252 GPCD.
How does water use relate to population?
People use water at their homes, at their workplace, to produce things, and for recreation. Using gallons per capita per day (GPCD) to represent water use for an area is a standard practice among water professionals. The GPCD calculation includes two pieces: population and water use. The population component used by the Division of Water Resources is the full-time, permanent population of the area. It does not count visitors or commuters. Visitor and commuter use is equally spread among the permanent population for the area. The water component includes all water use for the area: residential use inside a home, outside residential use for the home (yard and garden), parks, government buildings (inside and outside), schools (inside and outside), businesses, offices, churches, and industries. These uses, measured in gallons, are added together and divided by the population.
Tracking use is essential for planning
The division’s GPCD numbers are used to set goals and demonstrate accountability. Water systems that receive state funds for system improvements are required to account for water savings as a result of the investment. These numbers may be used to compare 2015 baseline water use to water use after improvements.
The division set regional water conservation goals with 2015 water use as the baseline. The division’s water use GPCD will be used to evaluate progress toward meeting the 2030 water conservation goals at county and regional levels.
LDWA’s Water Supply Use Reports
On a yearly basis all water systems in Utah are required to share their Water Supply Use Report to the Division of Drinking Water. We are required to report all (residential, commercial, institutional, and industrial) data. Below are the reports that have been submitted over the years:
1960 – Present* (*once year is completed)
Historic information spanning 90 years
| 2032 | 2031 | 2030 | 2029 | 2028 | 2027 | 2026 | 2025 | 2024 | 2023 |
| 2022 | 2021 | 2020 | 2019 | 2018 | 2017 | 2016 | 2015 | 2014 | 2013 |
| 2012 | 2011 | 2010 | 2009 | 2008 | 2007 | 2006 | 2005 | 2004 | 2003 |
| 2002 | 2001 | 2000 | 1999 | 1998 | 1997 | 1996 | 1995 | 1994 | 1993 |
| 1992 | 1991 | 1990 | 1989 | 1988 | 1987 | 1986 | 1985 | 1984 | 1983 |
| 1982 | 1981 | 1980 | 1979 | 1978 | 1977 | 1976 | 1975 | 1974 | 1973 |
| 1972 | 1971 | 1970 | 1969 | 1968 | 1967 | 1966 | 1965 | 1964 | 1963 |
| 1962 | 1961 | 1960 | 1959 | 1958 | 1957 | 1956 | 1955 | 1954 | 1953 |
| 1052 | 1951 | 1950 | 1949 | 1948 | 1947 | 1946 | 1945 | 1944 | 1943 |
| 1942 | 1941 | 1940 | 1939 | 1938 | 1937 | 1936 | 1935 | 1934 | 1933 |
- YEARS IN GREEN: Reports are missing.
